← All Markets
Overview
Strategy A
Strategy B
Trade Viewer
Regime Analysis
Entry Filters
Trading Costs
Monte Carlo
← Original Model
Monte Carlo Simulation
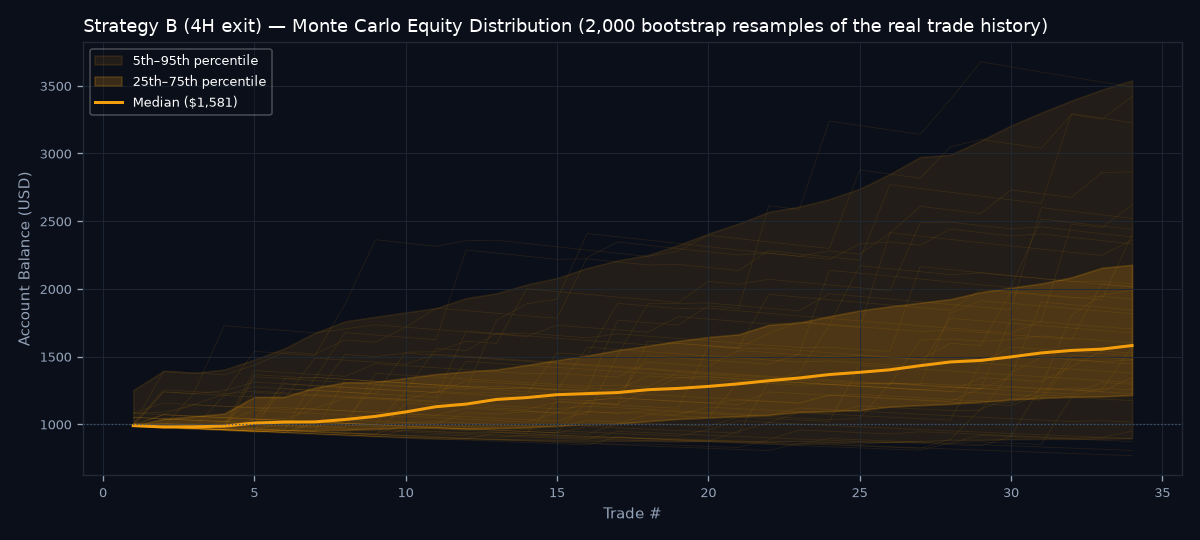
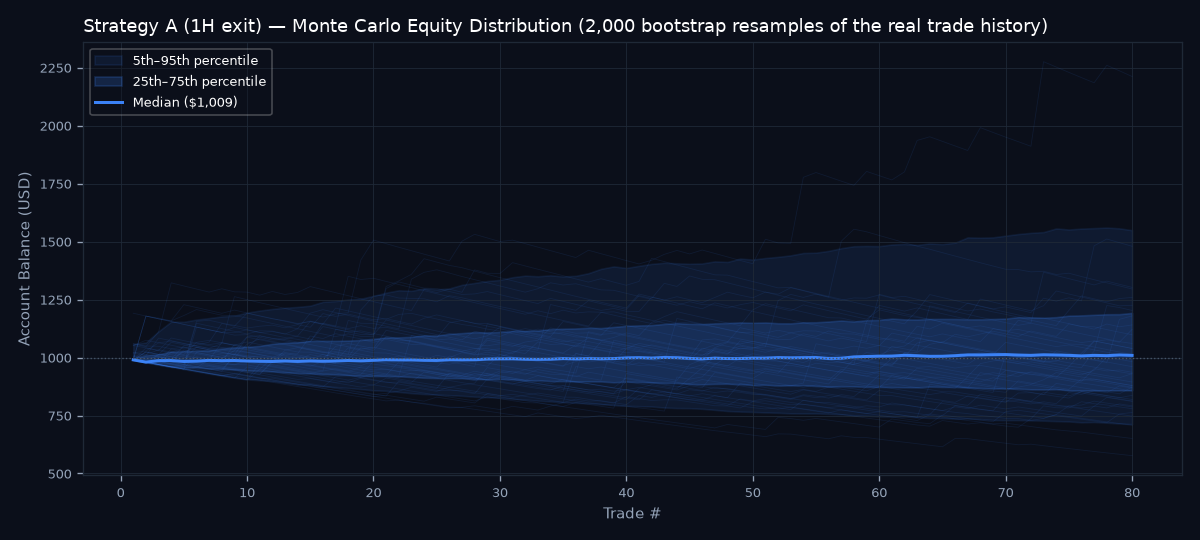
Bootstrap-resamples this strategy's own historical, NET-of-costs R-multiples (same trades the Trading Costs page uses) WITH replacement to build 2,000 alternate trade sequences, each as long as the real historical trade count — this captures the actual distribution's shape (fat tails, losing streaks, the real win rate) rather than assuming a clean win-rate/reward:risk model, and is cost-inclusive by construction. Starting balance $1,000, 1% of current balance risked per trade, compounding.
Caveat: bootstrap resampling assumes trades are independent (no serial correlation) — this project's own regime/walk-forward analysis found session and regime effects that mostly don't survive rigor, which supports independence as a reasonable approximation, but it isn't literally true for a trend-following-style structure strategy in real markets with regime persistence. Treat the figures below as a model of the historical trade distribution's dispersion, not a guarantee of future behavior.
Caveat: bootstrap resampling assumes trades are independent (no serial correlation) — this project's own regime/walk-forward analysis found session and regime effects that mostly don't survive rigor, which supports independence as a reasonable approximation, but it isn't literally true for a trend-following-style structure strategy in real markets with regime persistence. Treat the figures below as a model of the historical trade distribution's dispersion, not a guarantee of future behavior.
Strategy A
Probability of Profit
51.7%
Risk of Ruin (≤50% of start)
0.0%
Median Max Drawdown
19.14%
95th Pct Worst Drawdown
33.56%
Expected Value / Trade
+0.060R
Median Profit Factor
1.061
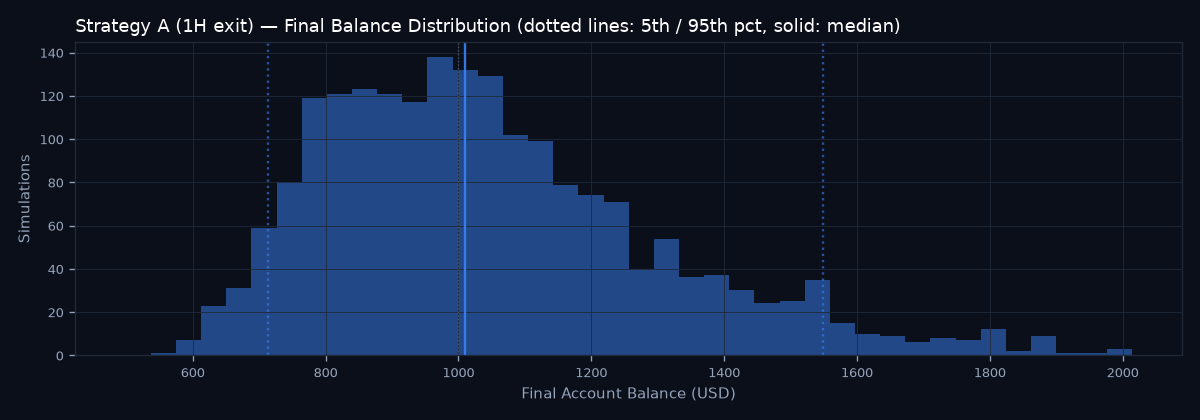
Final balance after 80 trades, across 2,000 simulations — 5th pct $713, 25th pct $859, median $1,009, 75th pct $1,192, 95th pct $1,549.
Strategy B
Probability of Profit
90.1%
Risk of Ruin (≤50% of start)
0.0%
Median Max Drawdown
10.27%
95th Pct Worst Drawdown
19.49%
Expected Value / Trade
+1.825R
Median Profit Factor
3.057
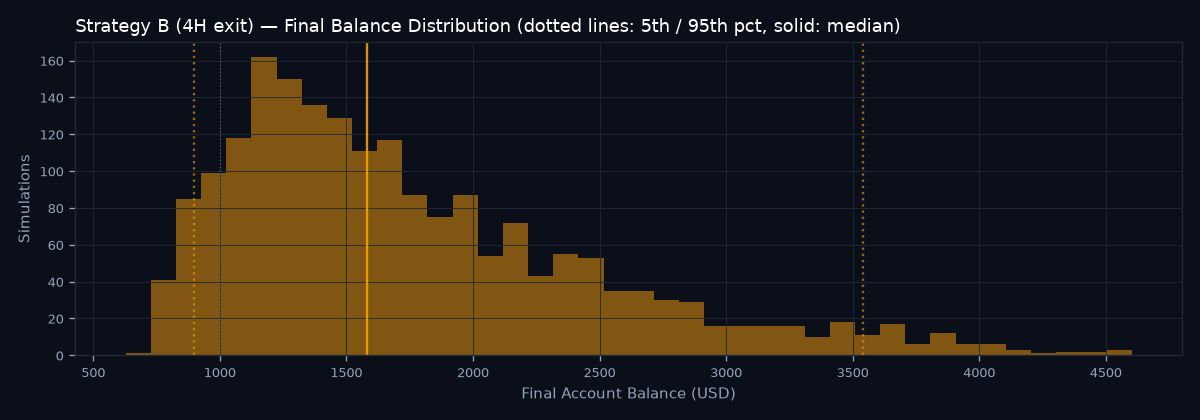
Final balance after 34 trades, across 2,000 simulations — 5th pct $897, 25th pct $1,216, median $1,581, 75th pct $2,178, 95th pct $3,540.