← All Markets
Overview
Strategy A
Strategy B
Trade Viewer
Regime Analysis
Entry Filters
Trading Costs
Monte Carlo
Variant Model →
Regime Analysis
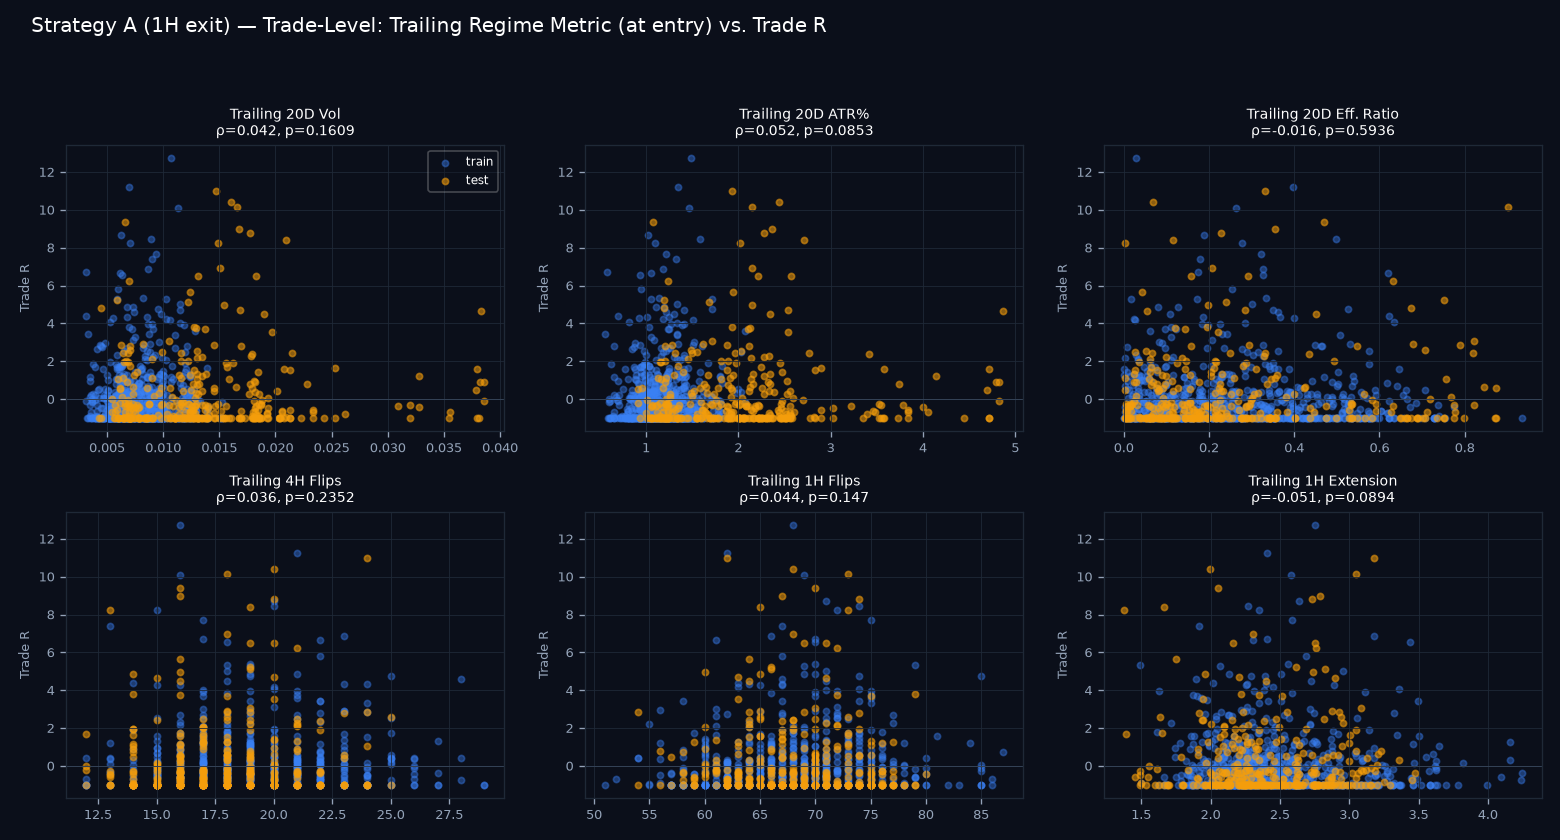
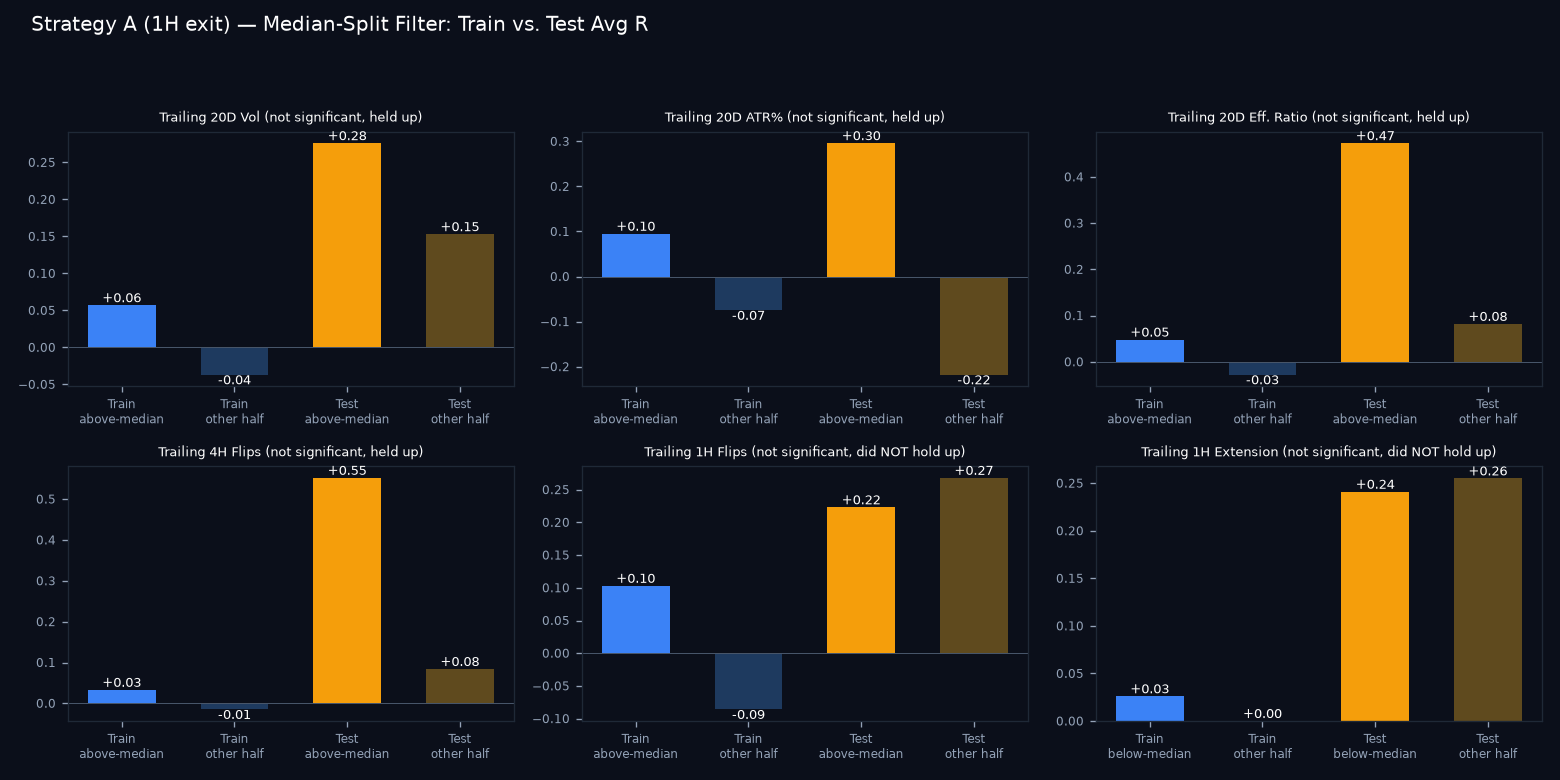
Corrected, ex-ante methodology. Every metric below is a TRAILING window (last 20 trading days / 480 1H bars / 120 4H bars) ending at each trade's own entry time, using only data that would actually have been known at that moment — no lookahead. Each trade is one data point (not each month), giving far more statistical power. Trades are split chronologically: the first 70% (train) is used only to pick a median threshold and a direction; the last 30% (test) is untouched until that frozen rule is checked against it. An earlier version of this page aggregated metrics over whole calendar months, which leaks future-within-the-month information into the metric — see the superseded section at the bottom for why that mattered.
Strategy A
1125 trades total — 787 train / 338 test.
| Metric | Spearman ρ (all trades) | p-value | Significant? | Train: filter vs. other | Test: filter vs. other | Held up? |
|---|---|---|---|---|---|---|
| Trailing 20D Realized Volatility (log-return std) | +0.042 | 0.1609 | n.s. | +0.06R vs -0.04R | +0.28R vs +0.15R | held up |
| Trailing 20D Avg ATR (% of price) | +0.052 | 0.0853 | n.s. | +0.10R vs -0.07R | +0.30R vs -0.22R | held up |
| Trailing 20D Trend Efficiency Ratio (Kaufman ER) | -0.016 | 0.5936 | n.s. | +0.05R vs -0.03R | +0.47R vs +0.08R | held up |
| Trailing 4H Structure Flips (last 120 bars) | +0.036 | 0.2352 | n.s. | +0.03R vs -0.01R | +0.55R vs +0.08R | held up |
| Trailing 1H Structure Flips (last 480 bars) | +0.044 | 0.1470 | n.s. | +0.10R vs -0.09R | +0.22R vs +0.27R | did not hold up |
| Trailing 1H Extension from EMA50 (x ATR14, last 480 bars) | -0.051 | 0.0894 | n.s. | +0.03R vs +0.00R | +0.24R vs +0.26R | did not hold up |
Strategy B
755 trades total — 528 train / 227 test.
| Metric | Spearman ρ (all trades) | p-value | Significant? | Train: filter vs. other | Test: filter vs. other | Held up? |
|---|---|---|---|---|---|---|
| Trailing 20D Realized Volatility (log-return std) | +0.030 | 0.4080 | n.s. | +0.15R vs +0.06R | +0.76R vs +0.41R | held up |
| Trailing 20D Avg ATR (% of price) | +0.048 | 0.1932 | n.s. | +0.14R vs +0.07R | +0.78R vs +0.47R | held up |
| Trailing 20D Trend Efficiency Ratio (Kaufman ER) | -0.029 | 0.4306 | n.s. | +0.17R vs +0.04R | +0.28R vs +0.79R | did not hold up |
| Trailing 4H Structure Flips (last 120 bars) | +0.033 | 0.3651 | n.s. | +0.22R vs -0.05R | +0.34R vs +0.59R | did not hold up |
| Trailing 1H Structure Flips (last 480 bars) | +0.044 | 0.2344 | n.s. | +0.14R vs +0.07R | +0.41R vs +0.57R | did not hold up |
| Trailing 1H Extension from EMA50 (x ATR14, last 480 bars) | -0.091 | 0.0128 | p < 0.05 | +0.12R vs +0.09R | +0.81R vs +0.14R | held up |
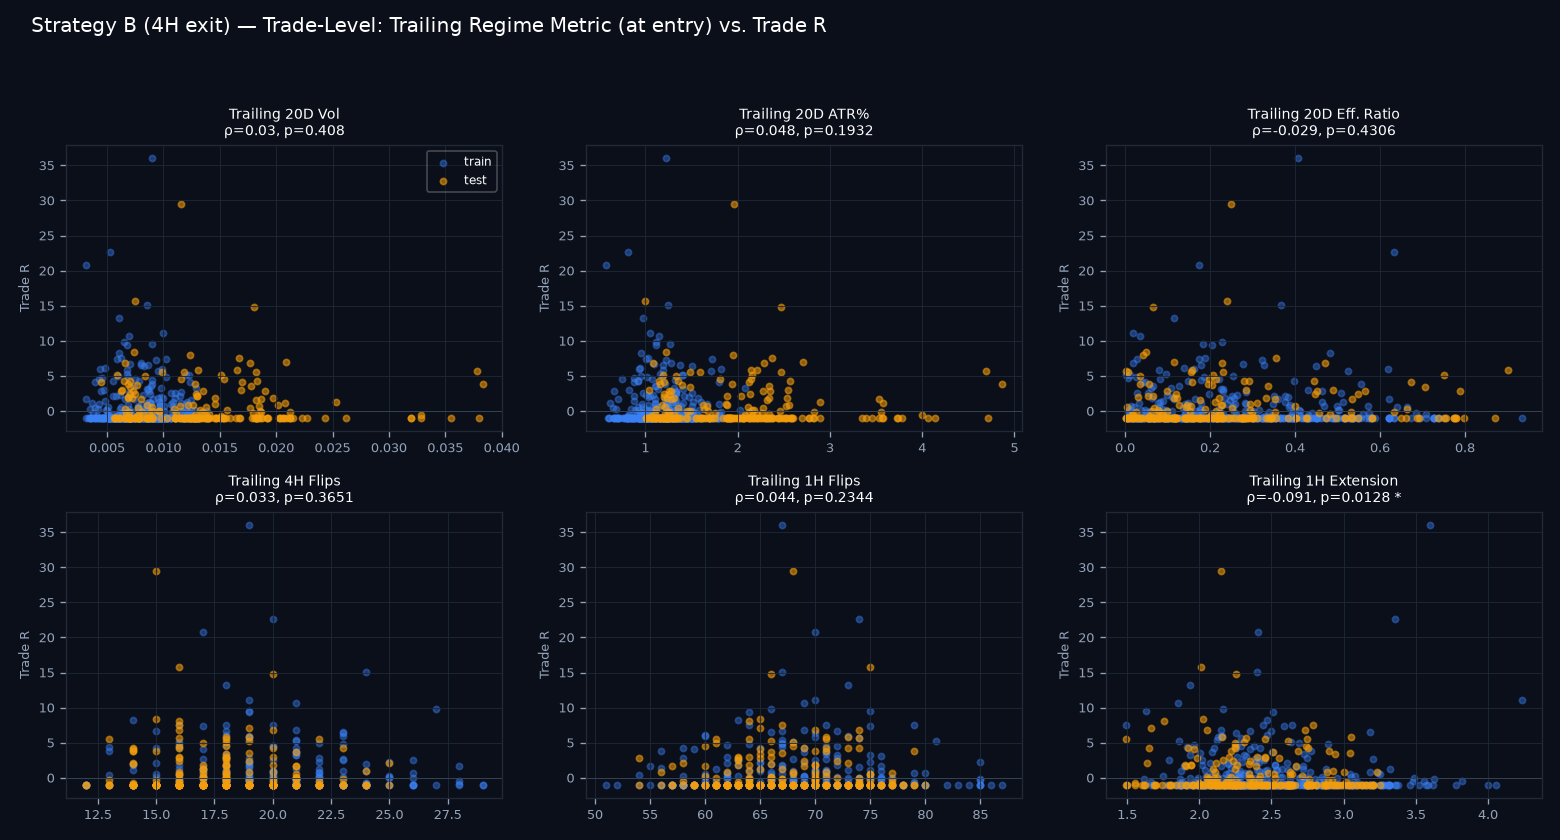
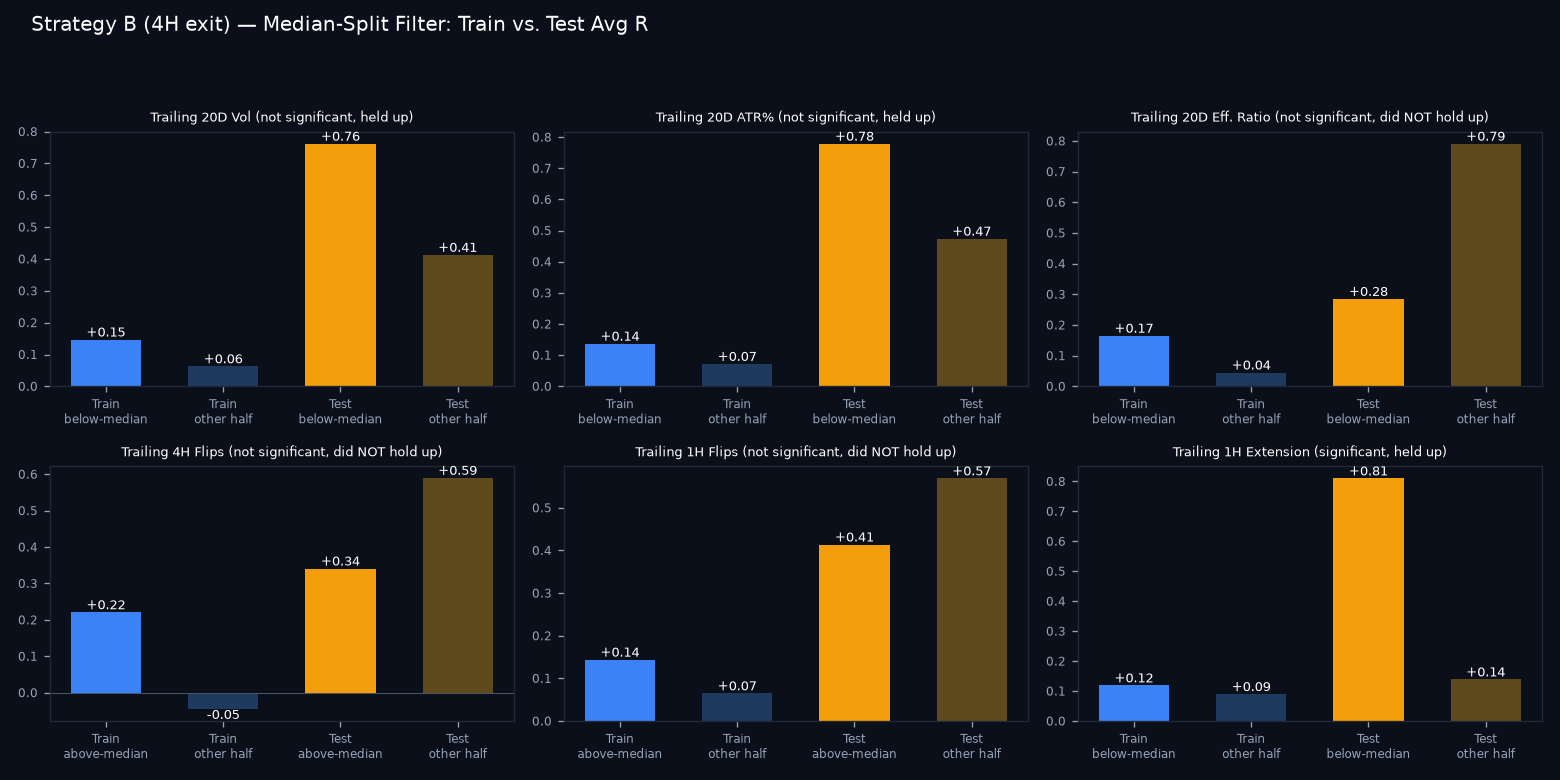
Bottom line: none of the six metrics tested reach statistical significance (p < 0.05) against individual trade outcomes for either strategy — correlations are all near zero (|ρ| < 0.1). Where a train/test split shows the same direction in both halves ('held up'), that is expected to happen by chance a meaningful fraction of the time when the underlying effect is this weak and six metrics are tested per strategy — it should not be read as a discovered filter. As of this data, none of these price/structure regime measures give an actionable, statistically defensible rule for skipping trades ahead of time.
Superseded: Original Monthly (Hindsight) Analysis
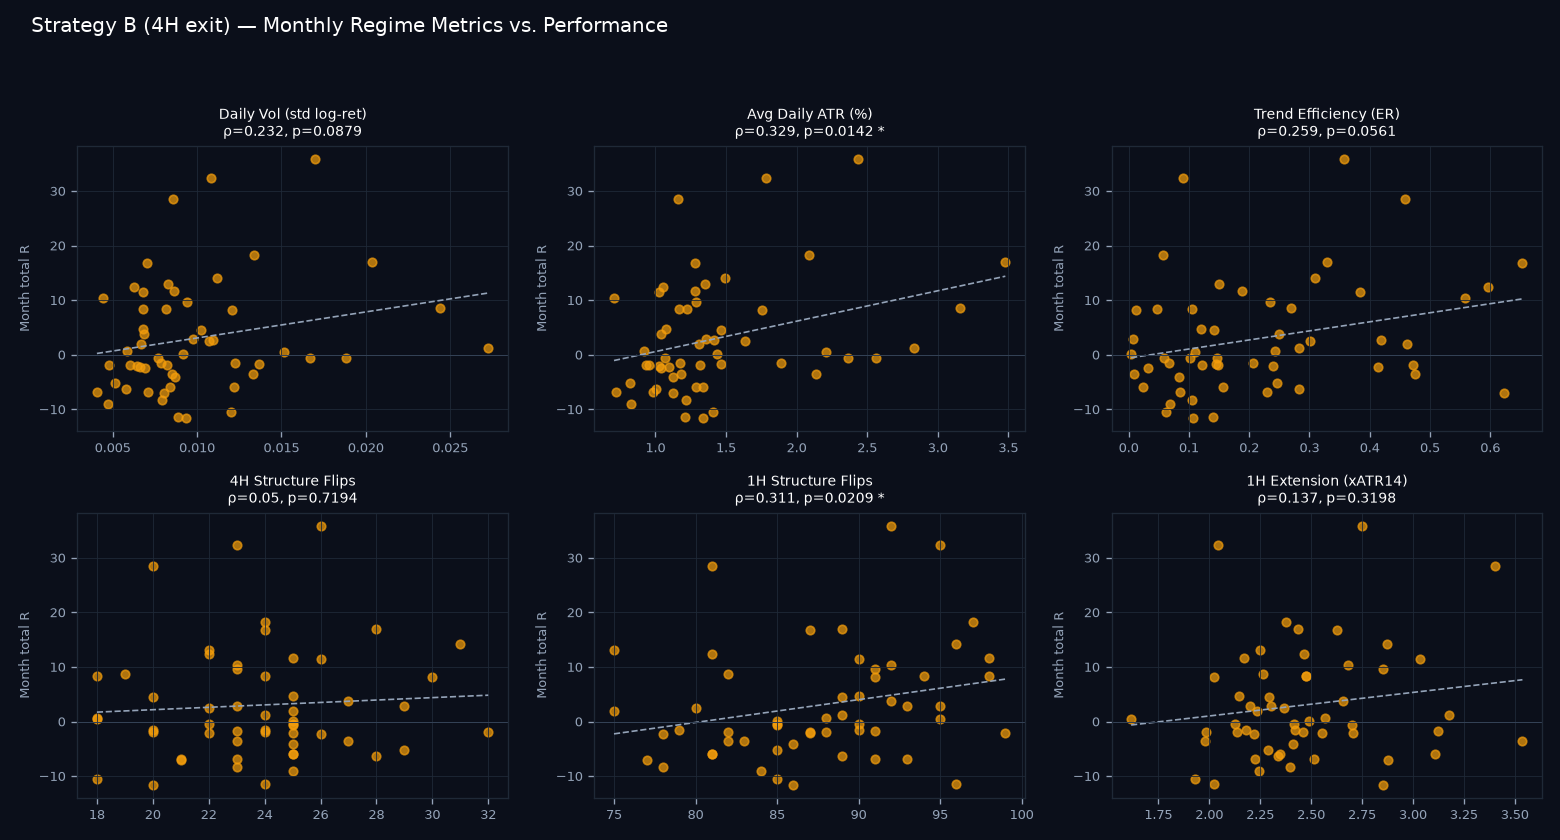
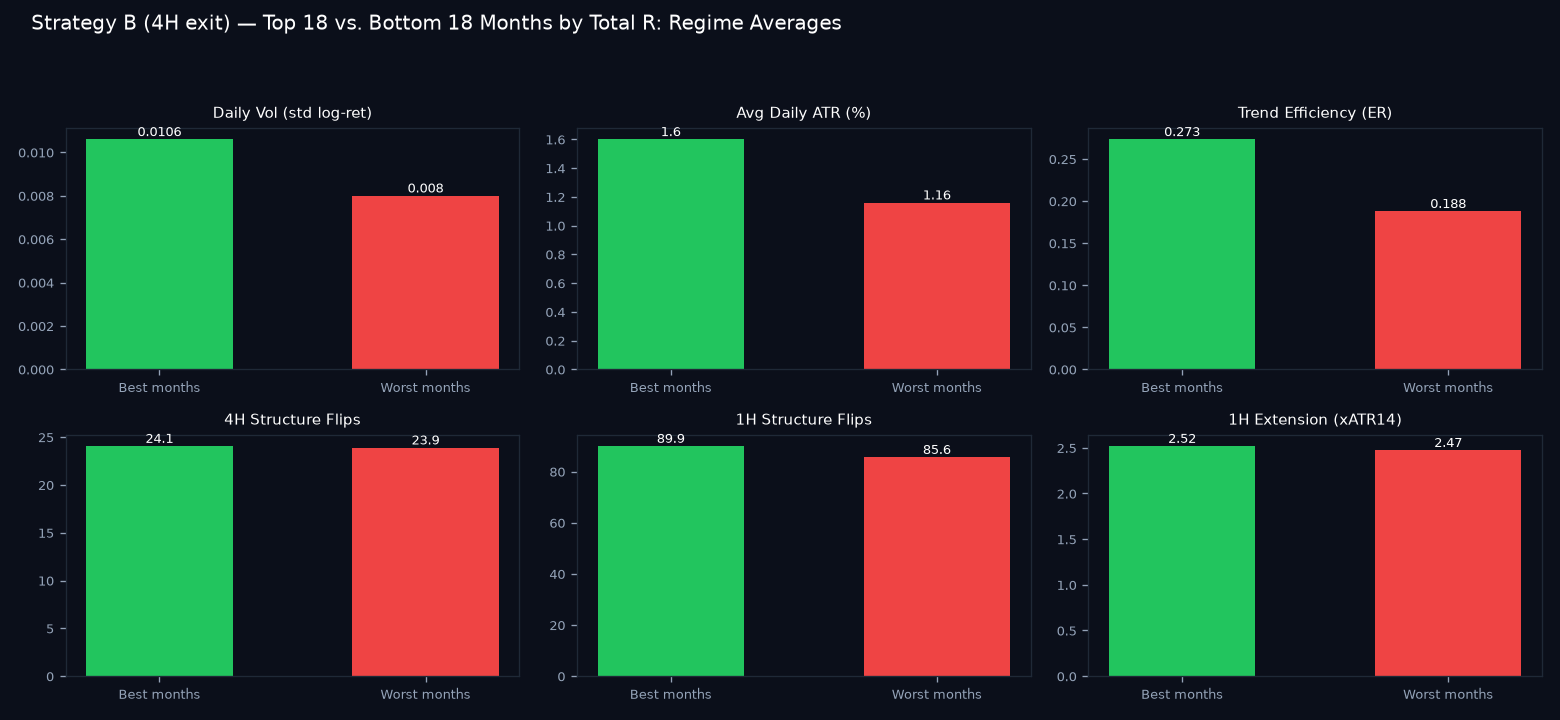
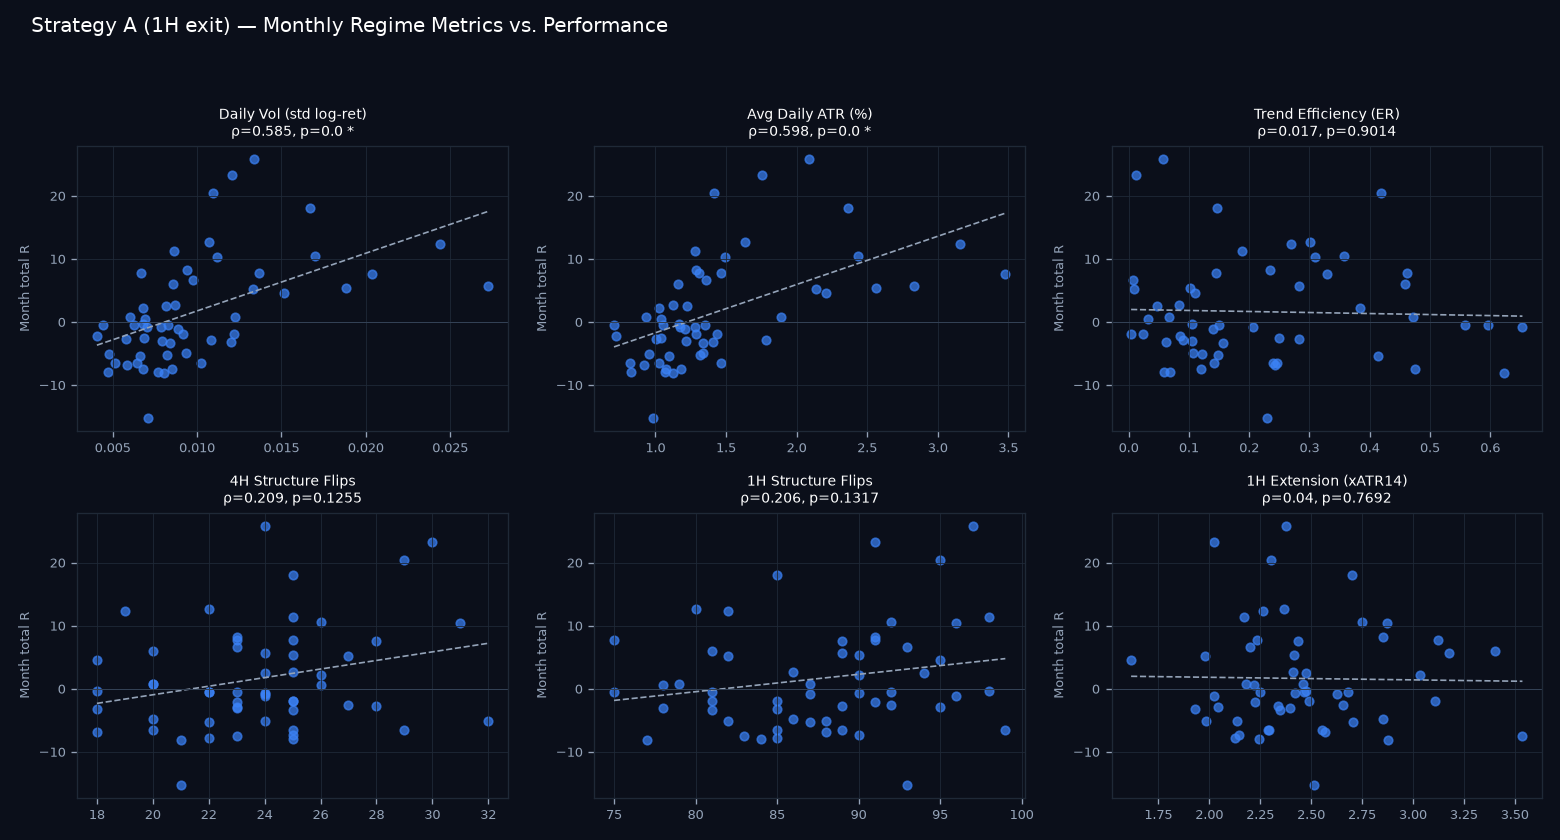
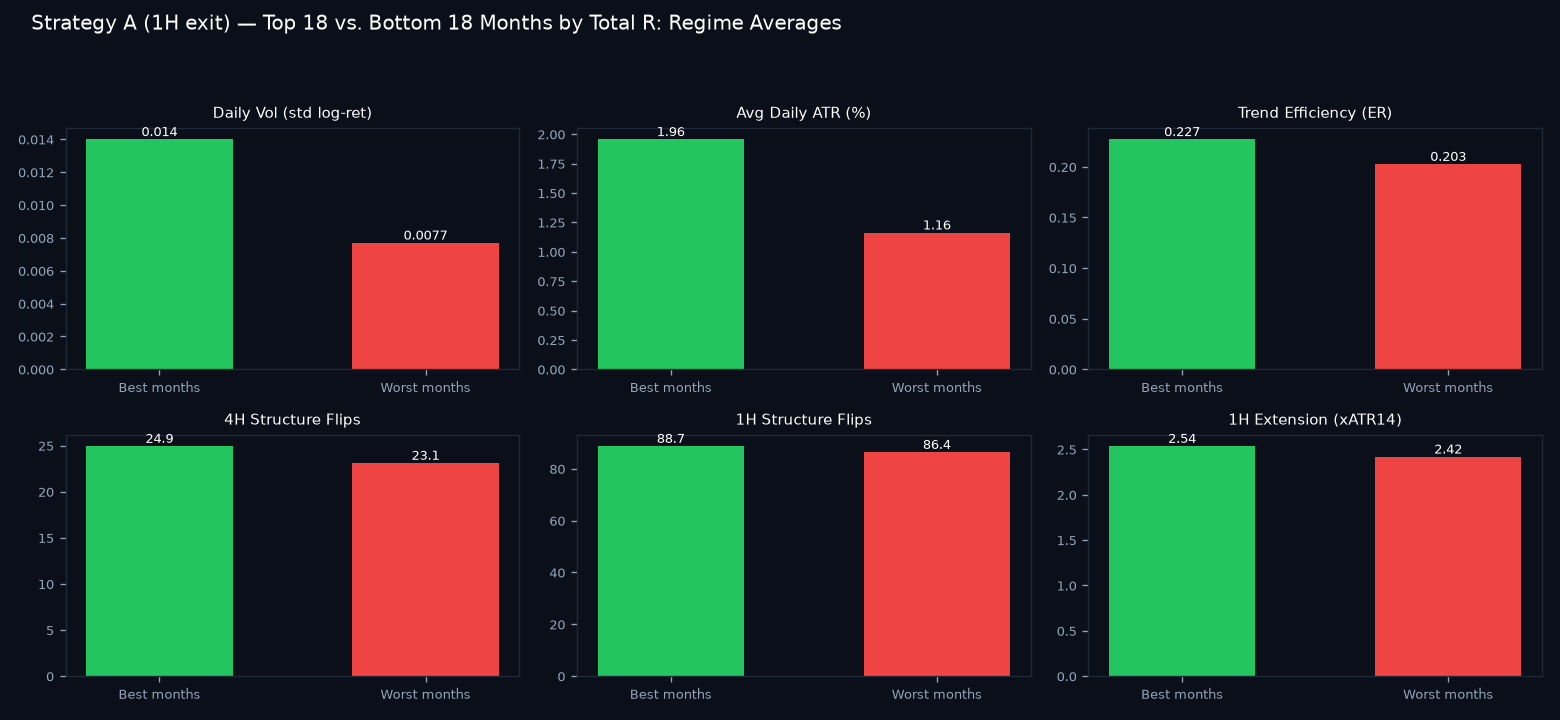
This section has a lookahead-bias flaw and is kept only for transparency — do not treat it as a trading rule. Each metric here was computed over the ENTIRE calendar month a trade closed in, including days after that trade. A month's full ATR% or trend-efficiency ratio isn't knowable until the month is over, so the strong-looking correlations below describe what characterized good/bad months in hindsight, not something that could have been acted on in real time. The corrected, trade-level, ex-ante version above supersedes this.
Strategy A
| Metric | Spearman ρ | p-value | Significant? |
|---|---|---|---|
| Daily Realized Volatility (log-return std) | +0.585 | 0.0000 | p < 0.05 |
| Avg Daily ATR (% of price) | +0.598 | 0.0000 | p < 0.05 |
| Trend Efficiency Ratio (Kaufman ER, 0-1) | +0.017 | 0.9014 | n.s. |
| 4H Structure Flips (BOS+CHoCH count) | +0.209 | 0.1255 | n.s. |
| 1H Structure Flips (BOS+CHoCH count) | +0.206 | 0.1317 | n.s. |
| 1H Extension from EMA50 (x ATR14) | +0.040 | 0.7692 | n.s. |
Strategy B
| Metric | Spearman ρ | p-value | Significant? |
|---|---|---|---|
| Daily Realized Volatility (log-return std) | +0.232 | 0.0879 | n.s. |
| Avg Daily ATR (% of price) | +0.329 | 0.0142 | p < 0.05 |
| Trend Efficiency Ratio (Kaufman ER, 0-1) | +0.259 | 0.0561 | n.s. |
| 4H Structure Flips (BOS+CHoCH count) | +0.050 | 0.7194 | n.s. |
| 1H Structure Flips (BOS+CHoCH count) | +0.311 | 0.0209 | p < 0.05 |
| 1H Extension from EMA50 (x ATR14) | +0.137 | 0.3198 | n.s. |