Entry Filters: Break-Quality & Session Timing
1. Break-Quality Features
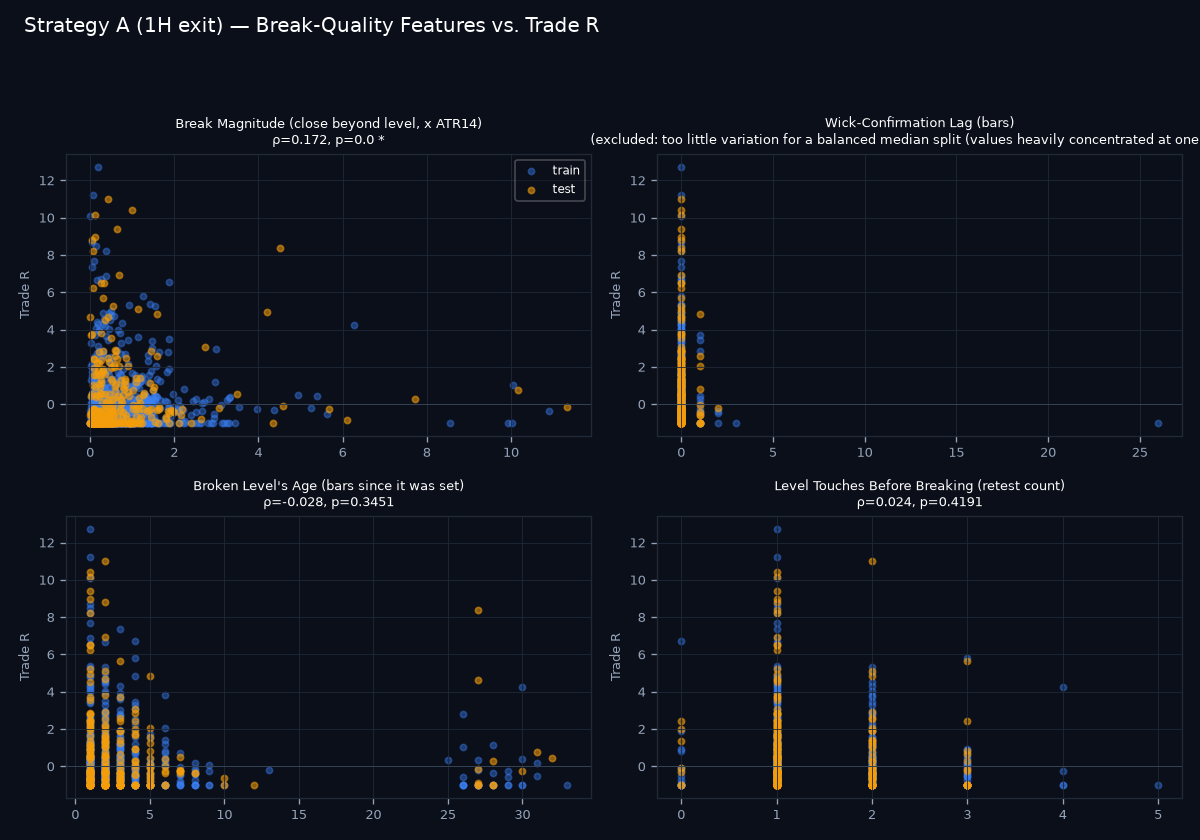
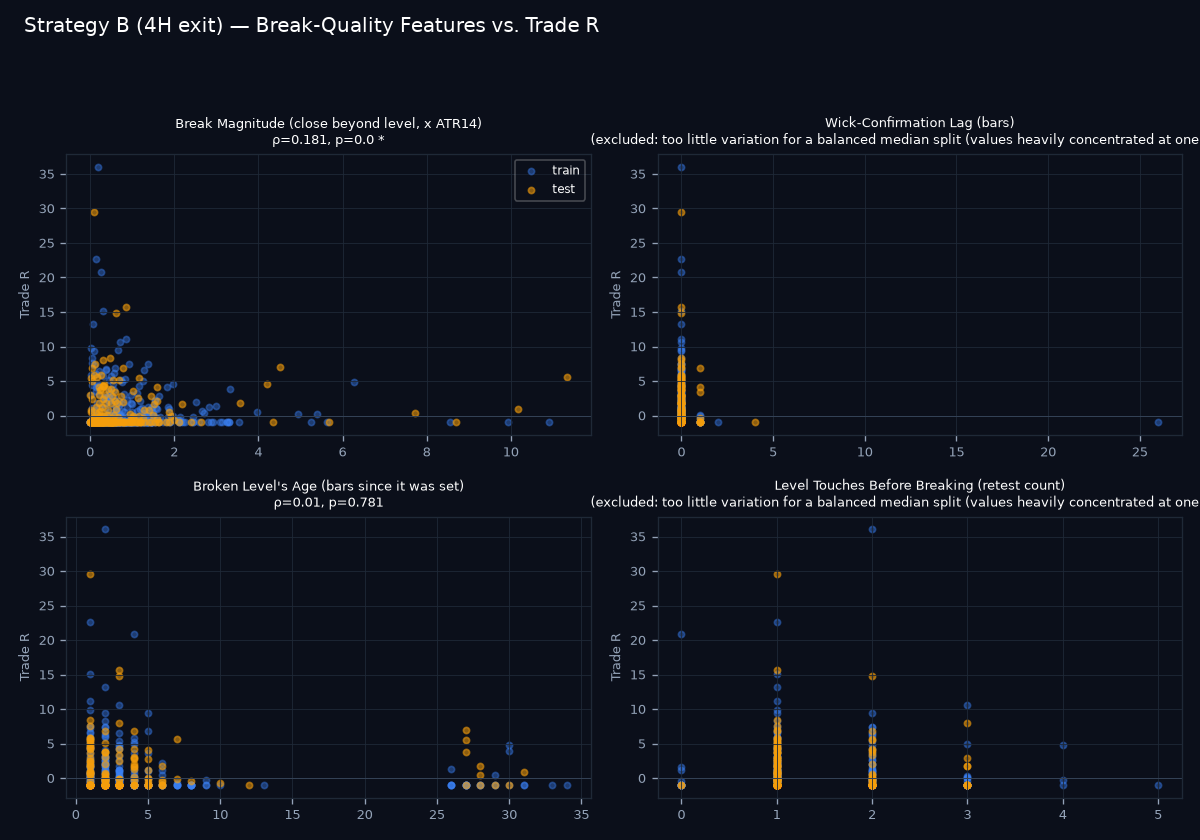
Properties of the specific break that triggered each entry — how far it cleared the level, how long the level had stood, how many times it was retested first — rather than the ambient market environment. All are intrinsic to the BOS/CHoCH signal itself.
Strategy A
| Metric | Spearman ρ | p-value | Significant? | Train: filter vs. other | Test: filter vs. other | Held up? |
|---|---|---|---|---|---|---|
| Break Magnitude (close beyond level, x ATR14) | +0.172 | 0.0000 | p < 0.05 | +0.01R vs +0.01R | +0.37R vs +0.15R | held up |
| Wick-Confirmation Lag (bars) | excluded — too little variation for a balanced median split (values heavily concentrated at one value) | |||||
| Broken Level's Age (bars since it was set) | -0.028 | 0.3451 | n.s. | +0.20R vs -0.09R | +0.47R vs +0.11R | held up |
| Level Touches Before Breaking (retest count) | +0.024 | 0.4191 | n.s. | +0.01R vs -0.11R | +0.24R vs +0.49R | did not hold up |
Strategy B
| Metric | Spearman ρ | p-value | Significant? | Train: filter vs. other | Test: filter vs. other | Held up? |
|---|---|---|---|---|---|---|
| Break Magnitude (close beyond level, x ATR14) | +0.181 | 0.0000 | p < 0.05 | +0.13R vs +0.07R | +0.56R vs +0.46R | held up |
| Wick-Confirmation Lag (bars) | excluded — too little variation for a balanced median split (values heavily concentrated at one value) | |||||
| Broken Level's Age (bars since it was set) | +0.010 | 0.7810 | n.s. | +0.15R vs +0.07R | +0.88R vs +0.31R | held up |
| Level Touches Before Breaking (retest count) | excluded — too little variation for a balanced median split (values heavily concentrated at one value) | |||||
Deep-Dive: Break Magnitude (Strategy A)
Break magnitude was the only metric across every family tested that cleared both significance and a single out-of-sample check. Before treating it as a real edge, three follow-up questions: is the relationship actually a smooth dose-response (quartiles, not just a median split), does it hold within both signal types and both directions rather than being driven by one subset, and does the direction stay stable across different train/test cuts of history (walk-forward), not just the one 70/30 split originally used?
Quartile Resolution
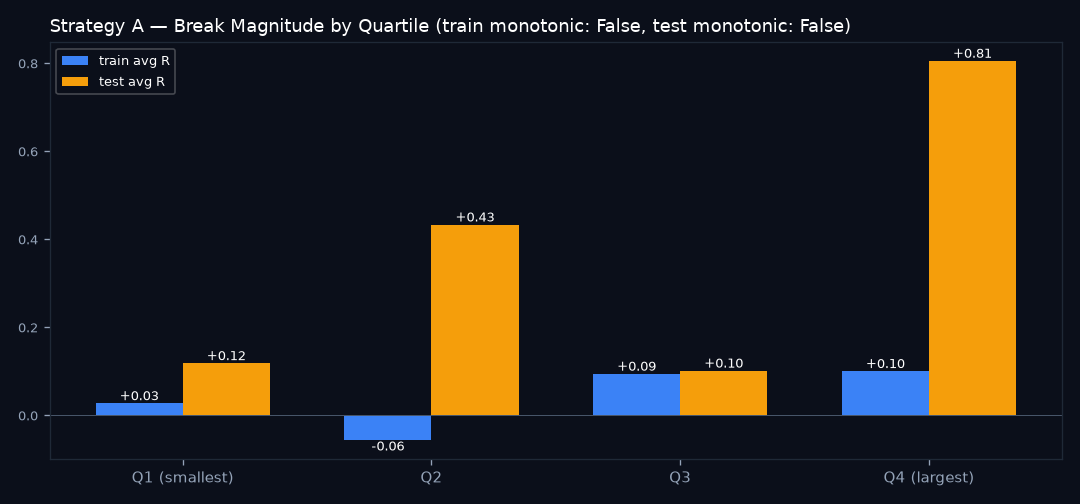
Train monotonic: False, test monotonic: False. Neither is — Q4 (largest breaks) does best in test, but Q2 outperforms Q3, so this isn't a clean 'bigger is always better' gradient. With only ~30-60 trades per quartile in test, some of this shape is likely noise.
By Signal Type
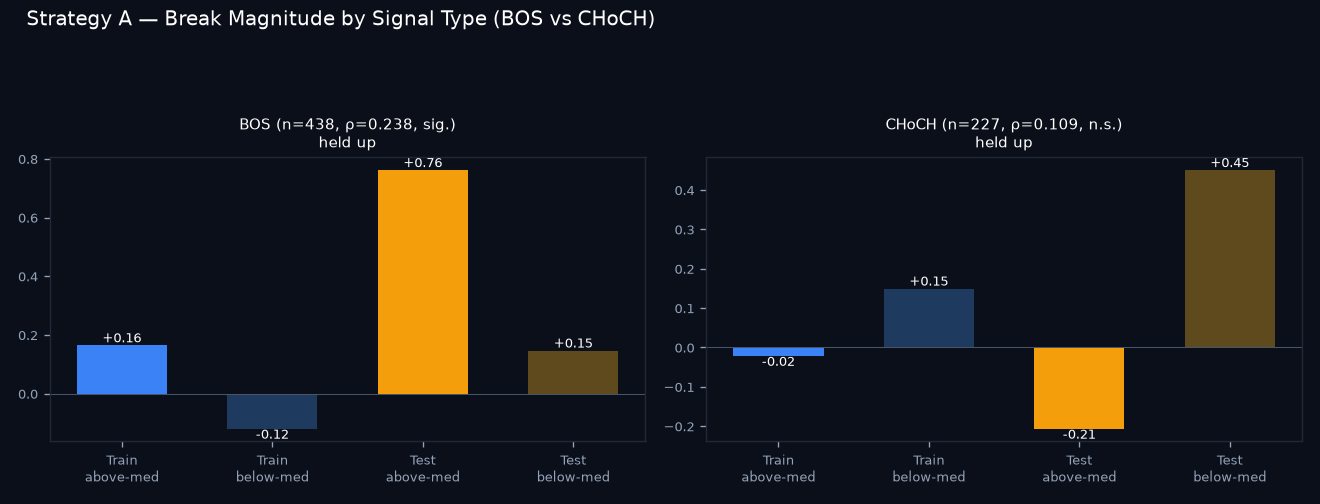
The effect is concentrated in BOS trades (n=438, ρ=0.238, p<0.001, large and consistent train/test gap). CHoCH trades don't reach significance (p=0.10) and — notably — lean the OPPOSITE direction: smaller breaks trend better for CHoCH, not larger. Plausible read: a decisive, large break fits a continuation (BOS) story, while a big overshoot on a reversal (CHoCH) may signal exhaustion rather than a clean turn — but with p=0.10 this is a hypothesis, not a finding.
By Direction
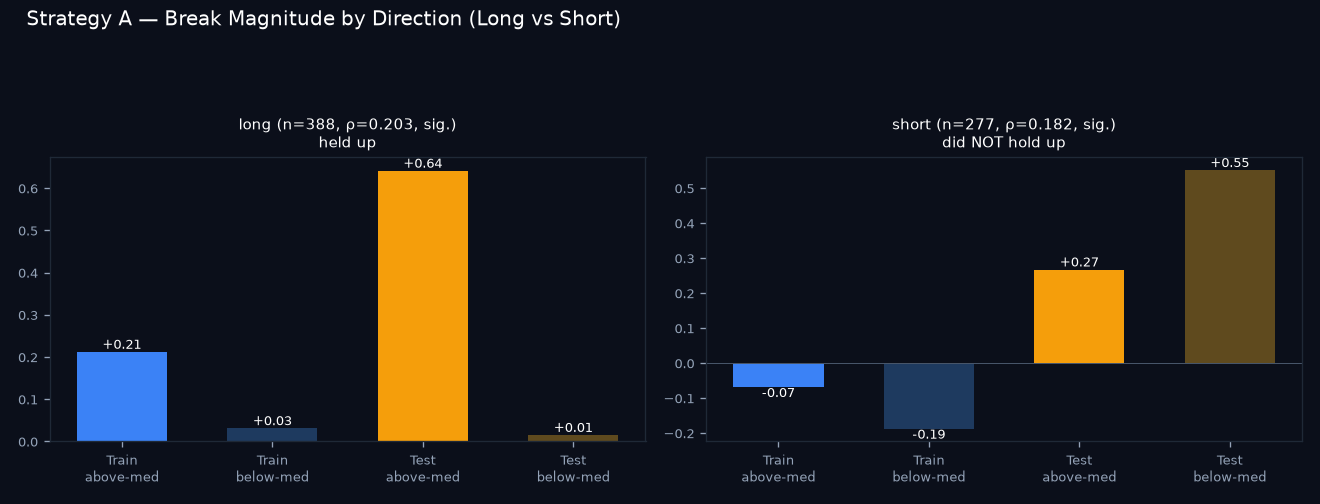
Similarly concentrated in longs: long trades (n=388, ρ=0.203, p<0.001) hold up out-of-sample with a wide gap; short trades are also significant (ρ=0.182, p=0.002) but the direction reverses in test. So the surviving signal is really 'break magnitude on BOS longs,' not 'break magnitude' in general.
Walk-Forward Robustness
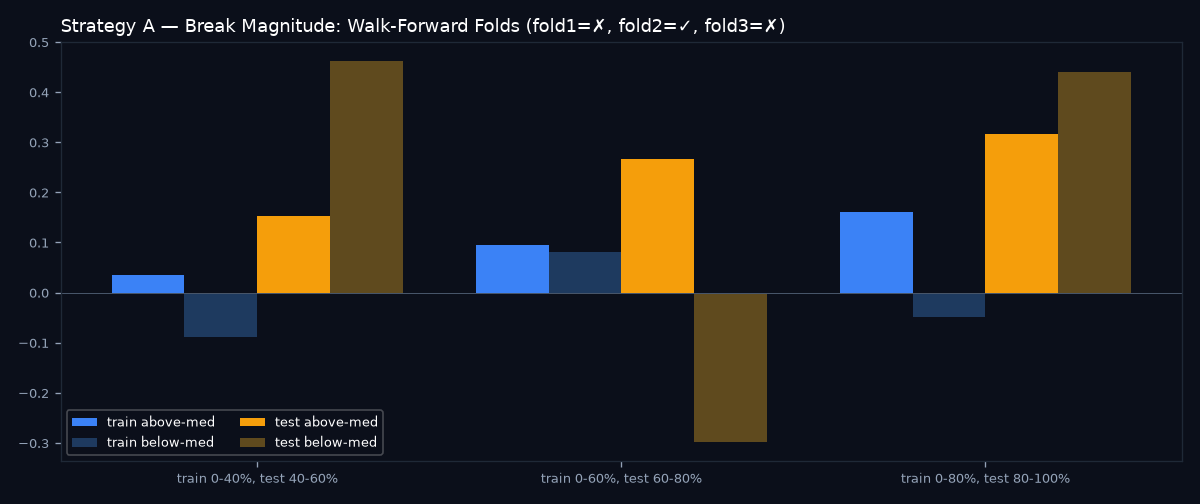
This is the most important check, and it tempers the finding considerably: across three sequential train/test cuts of the same data, the 'larger breaks do better' direction holds in only 1 of 3 folds. The original single 70/30 split happened to land on the one fold where it works. That doesn't mean there's nothing here — the aggregate correlation is still real and significant — but it does mean the effect is not stable enough across time to trust as a live filter yet.
2. Session / Time-of-Day
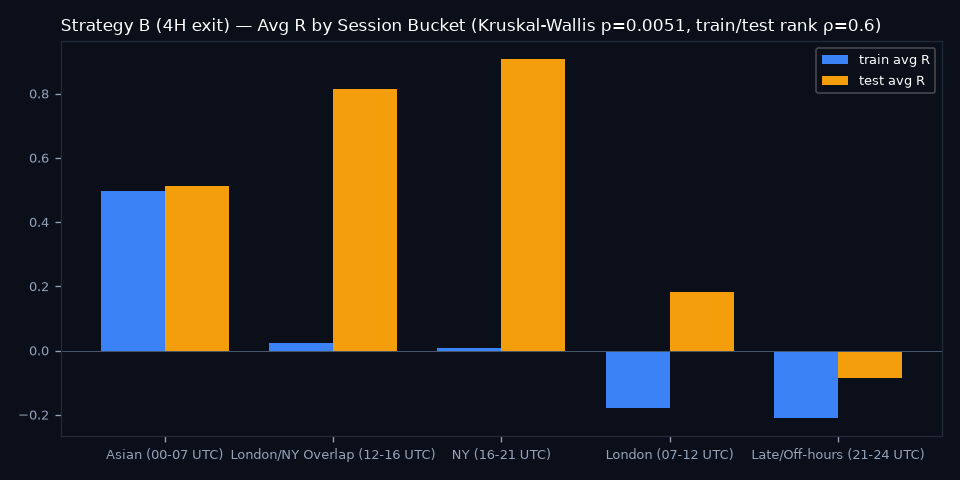
Entry hour (UTC), day-of-week, and a coarse session bucket (Asian/London/Overlap/NY/Off-hours). Purely calendar facts, so there is no lookahead risk at all — the question is only whether any grouping is stable, not whether it's knowable in advance. Kruskal-Wallis tests whether groups differ significantly within the training data; the train/test rank correlation checks whether the same groups stay best/worst in the untouched test data — the real test of whether a grouping means anything.
Strategy A
By Entry Hour (UTC): Kruskal-Wallis p=0.0023 (within-train group variation), train/test rank consistency ρ=0.128 (p=0.5517)
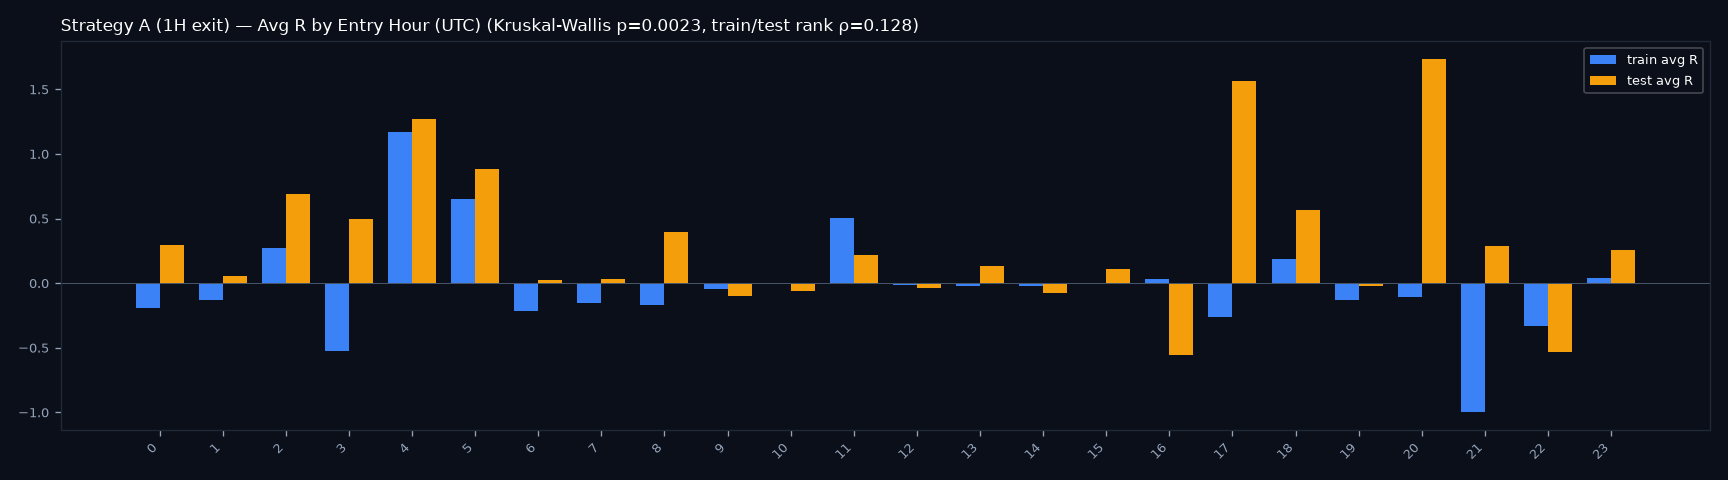
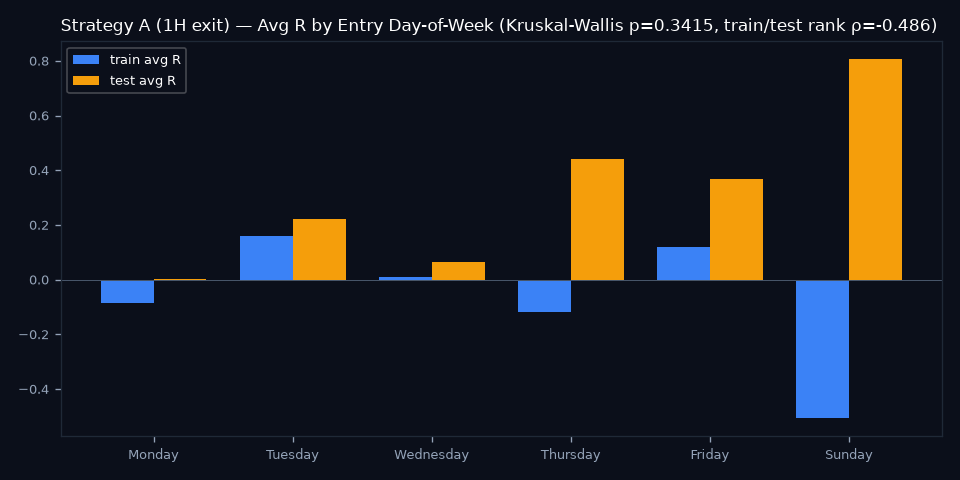
By Day of Week: Kruskal-Wallis p=0.3415 (within-train group variation), train/test rank consistency ρ=-0.486 (p=0.3287)
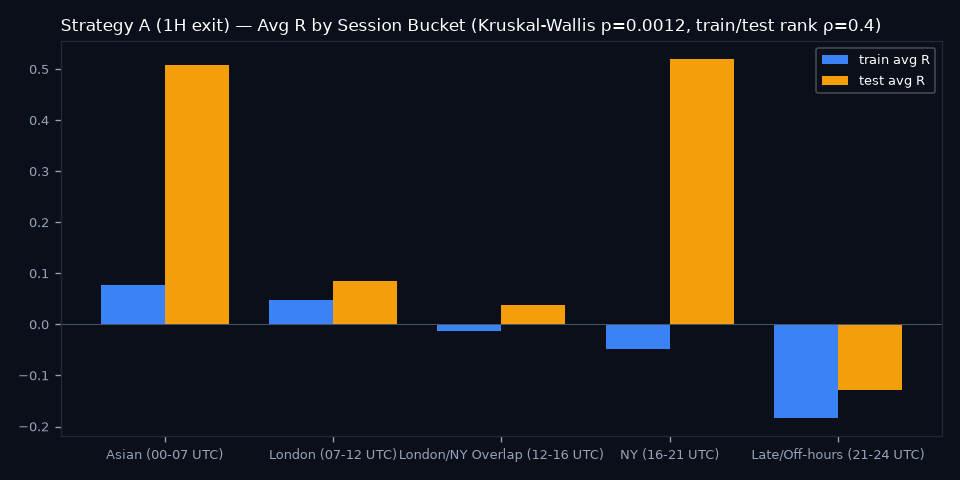
By Session Bucket: Kruskal-Wallis p=0.0012 (within-train group variation), train/test rank consistency ρ=0.4 (p=0.5046)
Strategy B
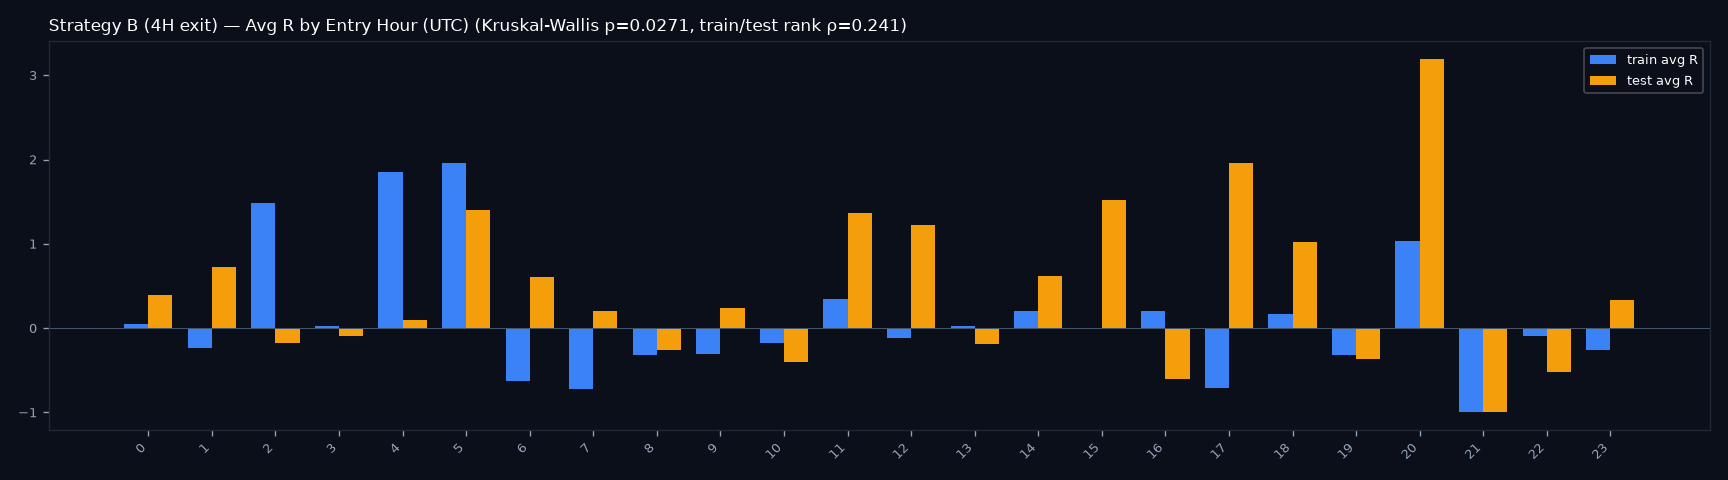
By Entry Hour (UTC): Kruskal-Wallis p=0.0271 (within-train group variation), train/test rank consistency ρ=0.241 (p=0.2569)
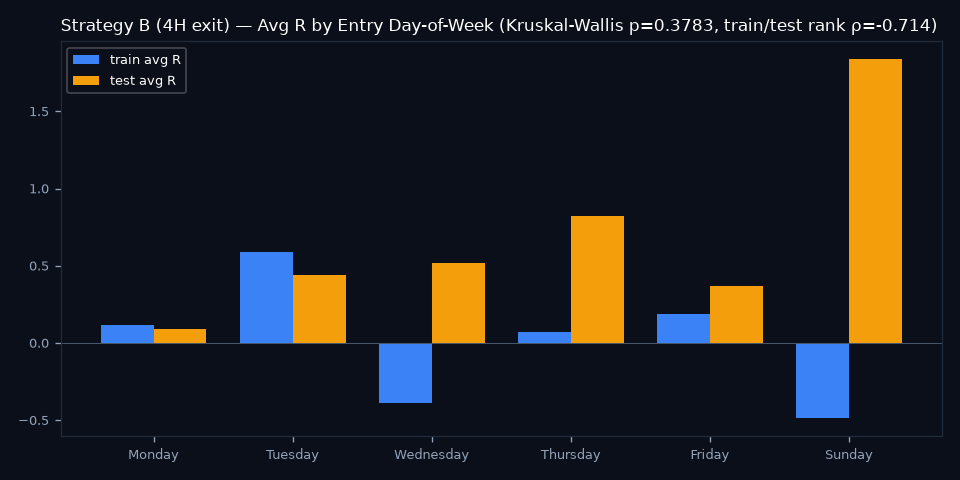
By Day of Week: Kruskal-Wallis p=0.3783 (within-train group variation), train/test rank consistency ρ=-0.714 (p=0.1108)
By Session Bucket: Kruskal-Wallis p=0.0051 (within-train group variation), train/test rank consistency ρ=0.6 (p=0.2848)
3. Unused Multi-Timeframe Information
The Pine script already computes Daily bias and displays it on the dashboard, but neither strategy's entry logic uses it. Two questions: does requiring Daily bias to also agree with the trade direction (not just 4H) help, and does how long the 4H bias has already been running at entry ('trend maturity') matter — trading a fresh 4H turn vs. chasing an extended one?
Strategy A
Daily-Bias Alignment
| Group | Train avg R (n) | Test avg R (n) |
|---|---|---|
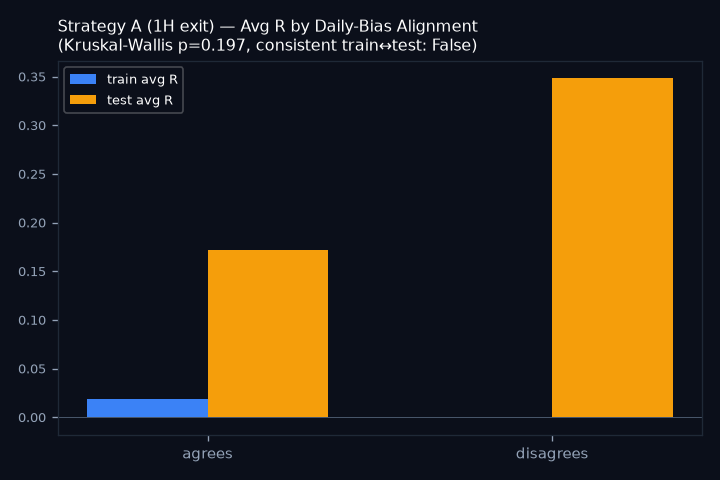
| agrees | +0.02R (n=450) | +0.17R (n=194) |
| disagrees | -0.00R (n=333) | +0.35R (n=144) |
Kruskal-Wallis p=0.197, consistent train→test: False
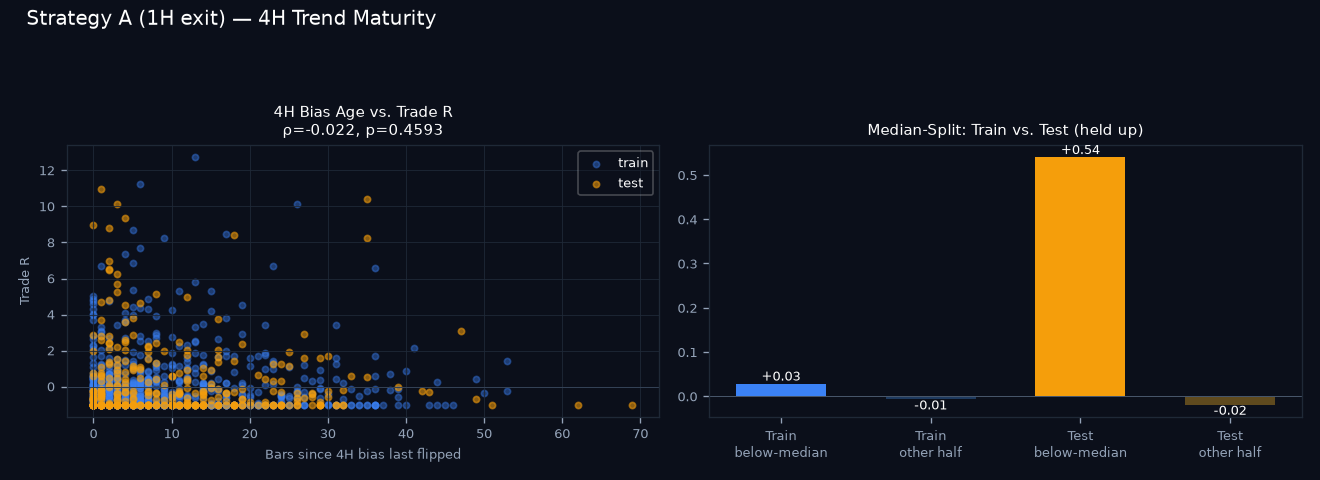
4H Trend Maturity (bars since 4H bias last flipped)
ρ=-0.022, p=0.4593 (not significant) — train below-median +0.03R vs -0.01R, test +0.54R vs -0.02R — held up
Strategy B
Daily-Bias Alignment
| Group | Train avg R (n) | Test avg R (n) |
|---|---|---|
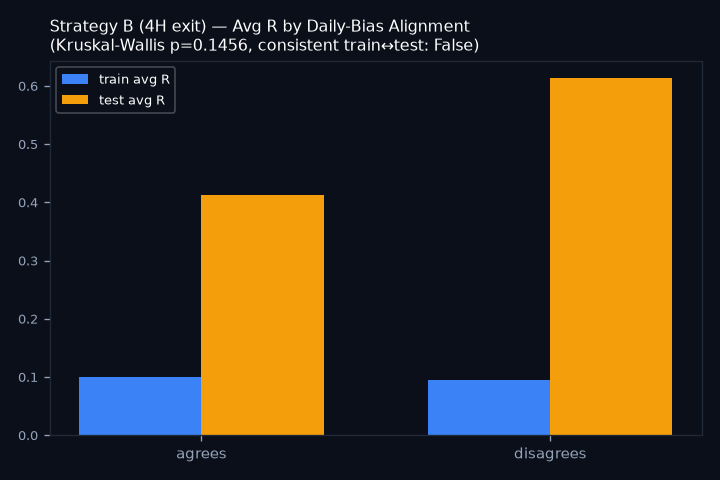
| agrees | +0.10R (n=277) | +0.41R (n=122) |
| disagrees | +0.10R (n=247) | +0.61R (n=105) |
Kruskal-Wallis p=0.1456, consistent train→test: False
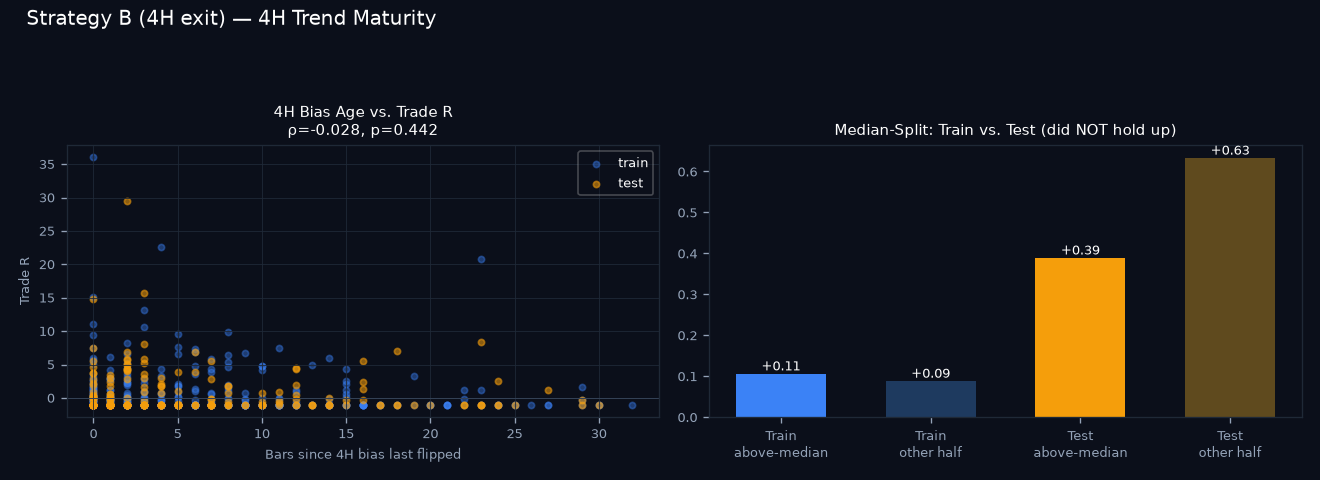
4H Trend Maturity (bars since 4H bias last flipped)
ρ=-0.028, p=0.4420 (not significant) — train above-median +0.11R vs +0.09R, test +0.39R vs +0.63R — did not hold up