← All Markets
Overview
Strategy A
Strategy B
Trade Viewer
Regime Analysis
Entry Filters
Trading Costs
Monte Carlo
Variant Model →
Trading Costs: Gross vs. Net
Every result shown elsewhere on this site is GROSS — zero fees, zero funding. This page applies a real Bybit USDT-perpetual cost model to every trade: 0.055% taker fee on both entry and exit (this strategy's entries/exits are structure breaks and stop-hits — effectively market orders, not resting limit orders that could earn the lower maker rate), plus Bybit's actual historical BTCUSDT funding rate at every 8-hour funding timestamp the trade was open for, applied to the BTC price at that moment — a long pays when the rate is positive and receives when negative, the standard perpetual-funding convention. Both figures are computed per-trade (unlike a fixed spread, a perpetual's cost scales with price and with how long the position was held) then converted to an R-multiple deduction using each trade's own risk (|entry − stop|), same as every other market on this site. Basis: Bybit USDT-perpetual — taker fee (0.055%/side) + actual historical funding rate over each trade's holding period.
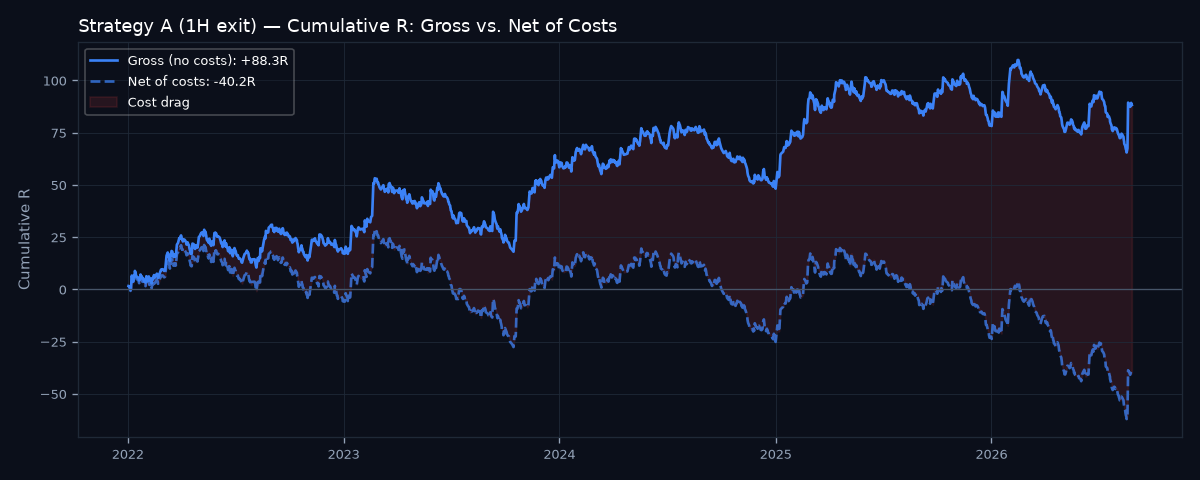
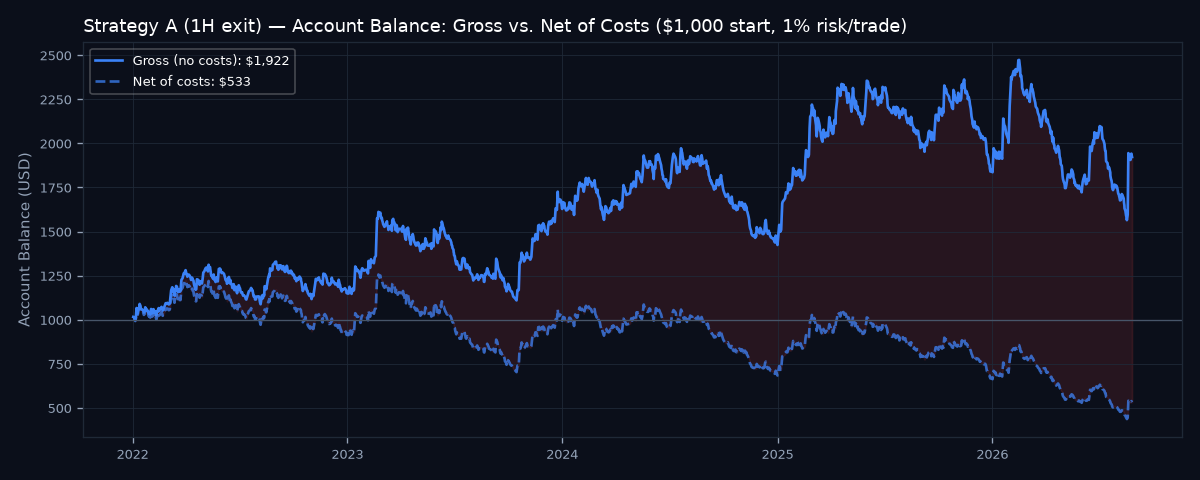
Strategy A
Avg cost per trade: 0.079R. edge does NOT survive costs
Avg R/Trade
+0.05 → -0.03
Total R
+88.3 → -40.2
Profit Factor
1.109 → 0.955
Win Rate
32.04% → 30.44%
Final Balance ($1,000 start)
$1,922 → $533
Strategy B
Avg cost per trade: 0.086R. edge survives costs
Avg R/Trade
+0.14 → +0.05
Total R
+148.7 → +56.7
Profit Factor
1.199 → 1.07
Win Rate
23.26% → 22.61%
Final Balance ($1,000 start)
$2,763 → $1,107
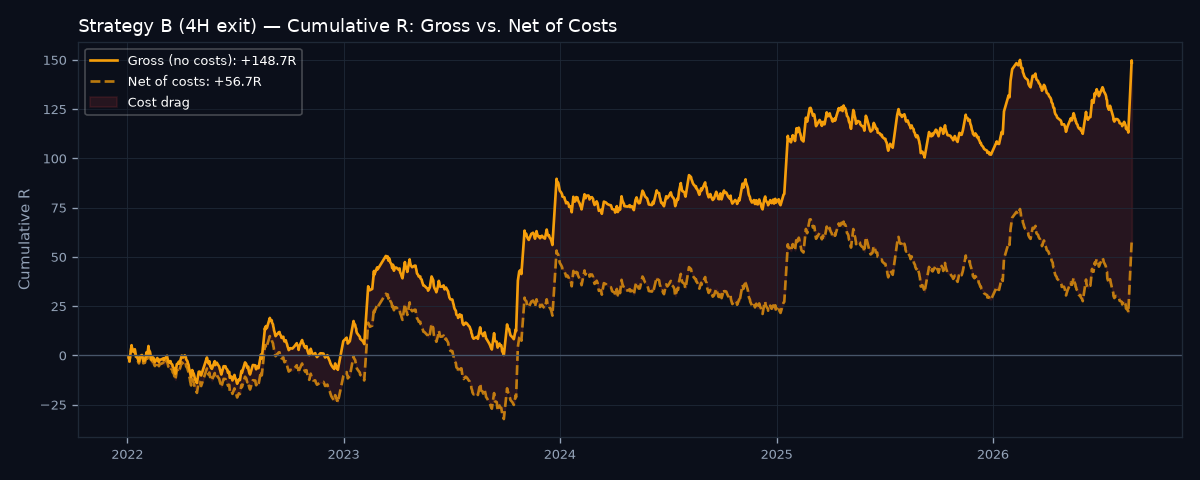
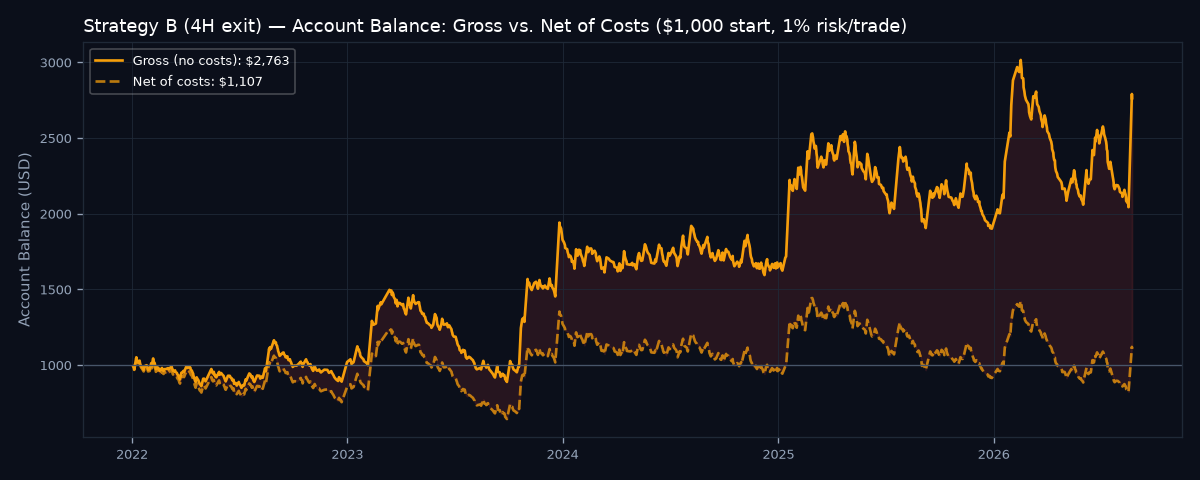
Read: at least one strategy does NOT survive this cost estimate — its apparent edge is an artifact of ignoring execution costs. Strategy A's total return is reduced by 145.5% after costs, Strategy B's by 61.9%. Whichever strategy has the thinner gross avg R/trade (here, Strategy A) has the least margin to absorb execution costs before its edge becomes marginal — if funding rates or realized slippage on fills run meaningfully worse than the historical average used here, that strategy is the one to re-examine first.