← All Markets
Overview
Strategy A
Strategy B
Trade Viewer
Regime Analysis
Entry Filters
Trading Costs
Monte Carlo
← Original Model
Trading Costs: Gross vs. Net
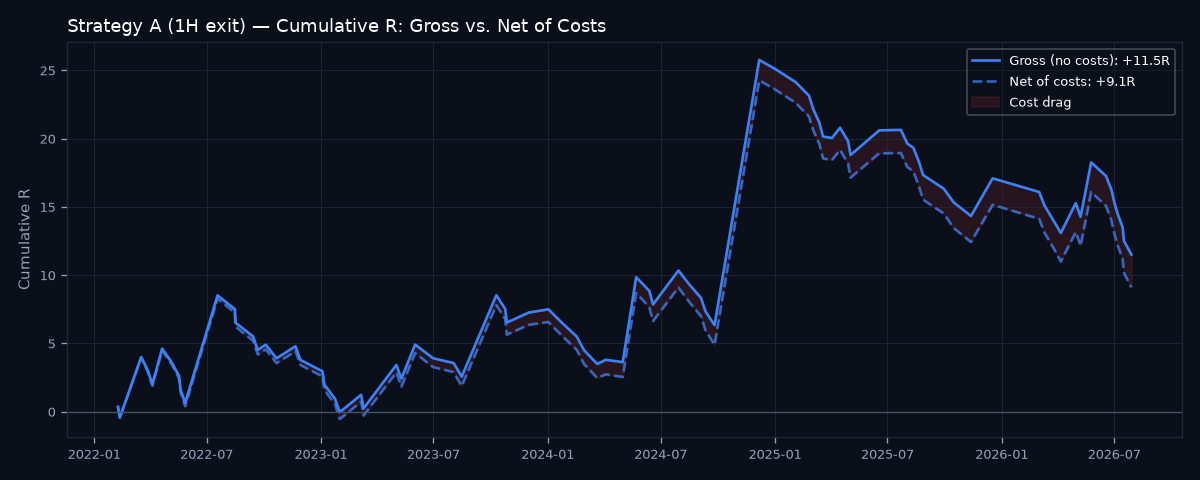
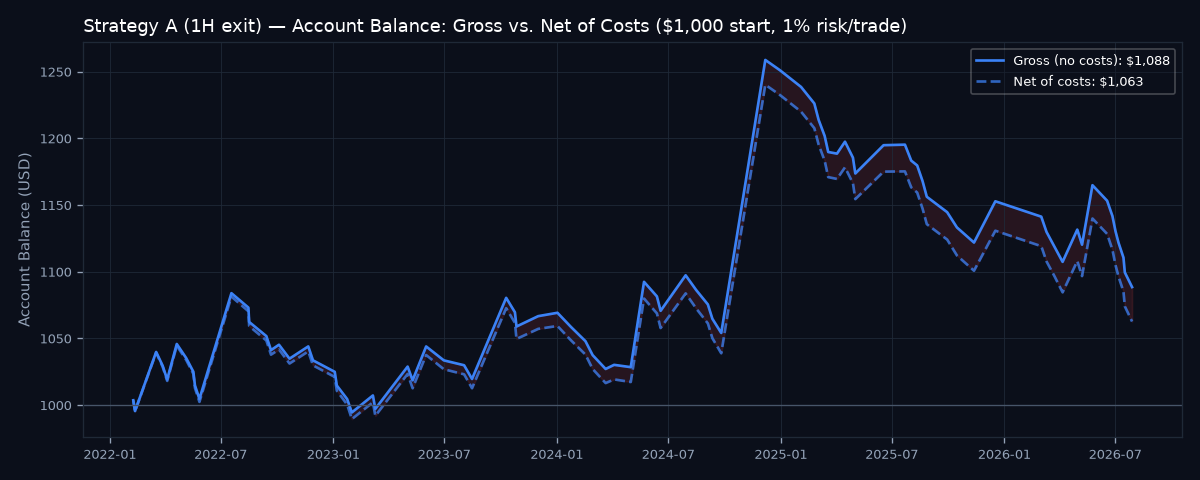
Every result shown elsewhere on this site is GROSS — zero spread, zero commission, zero slippage. This page applies a realistic broker cost model to every trade. Assumptions, from Euro / US Dollar (EUR/USD)'s cost basis (Vantage FX Raw ECN — user's own account Commission page ($5 USD/lot round-turn) + published spread range): spread $1e-05/unit, commission $5e-05/unit round-turn, and an estimated $4e-05/unit slippage — BOS/CHoCH entries and stop-outs both fire exactly when price is moving fast through a level, which is when slippage is worst; this is a working estimate, not a broker-quoted figure, and could be worse in a fast market. Total assumed round-trip cost: $0.0001/unit, converted to an R-multiple deduction using each trade's own risk (|entry − stop|) — the same normalization R itself already uses, so it applies consistently regardless of position size.
Strategy A
Avg cost per trade: 0.028R. edge survives costs
Avg R/Trade
+0.14 → +0.11
Total R
+11.5 → +9.1
Profit Factor
1.195 → 1.15
Win Rate
25.88% → 25.88%
Final Balance ($1,000 start)
$1,088 → $1,063
Strategy B
Avg cost per trade: 0.030R. edge survives costs
Avg R/Trade
+0.35 → +0.32
Total R
+20.1 → +18.4
Profit Factor
1.43 → 1.381
Win Rate
17.24% → 17.24%
Final Balance ($1,000 start)
$1,158 → $1,138
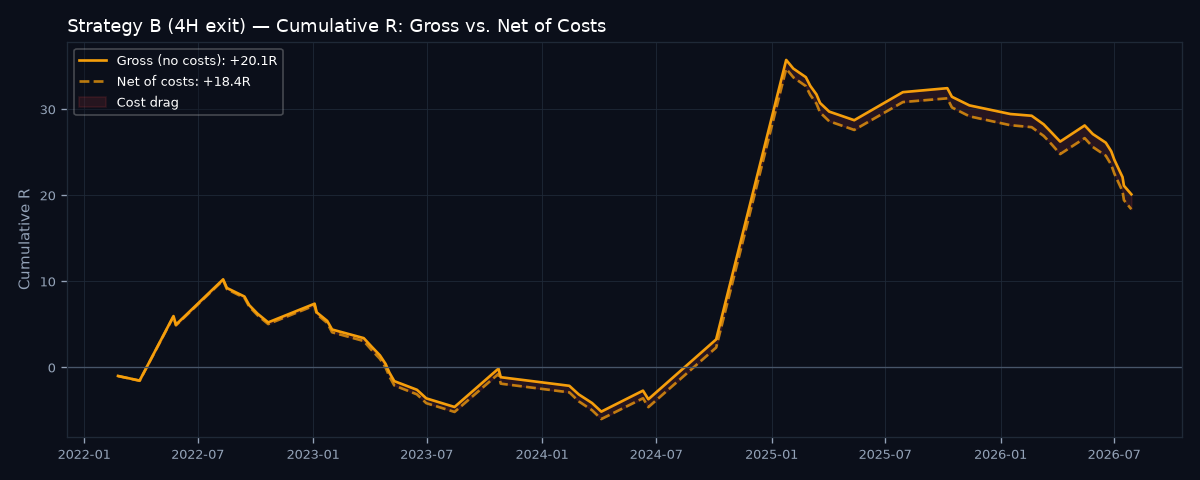
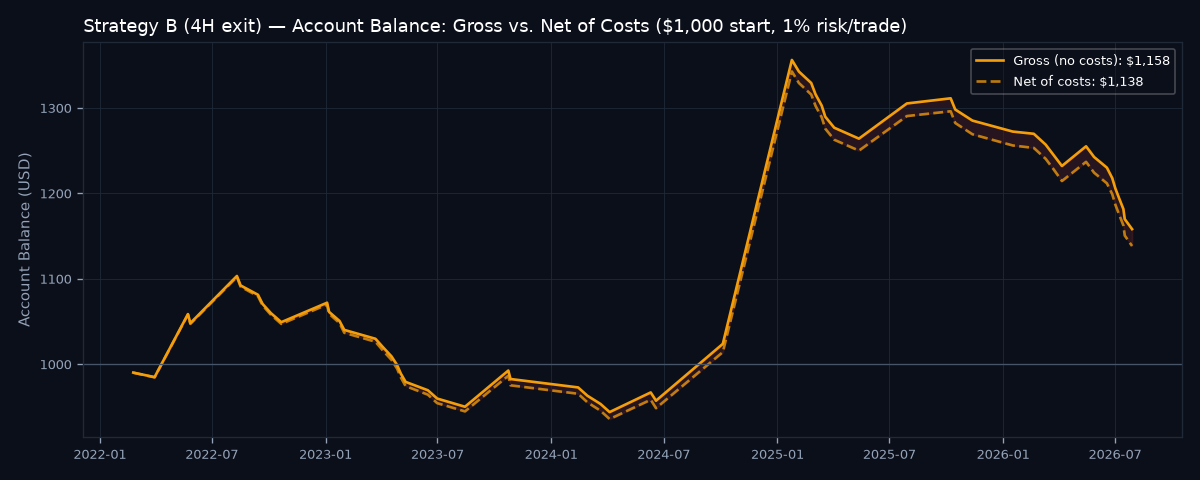
Read: both strategies survive this cost estimate with a positive net edge. Strategy A's total return is reduced by 20.9% after costs, Strategy B's by 8.6%. Whichever strategy has the thinner gross avg R/trade (here, Strategy A) has the least margin to absorb execution costs before its edge becomes marginal — if real slippage runs meaningfully higher than assumed here, that strategy is the one to re-examine first.